Forms
Actions
Alerts
Associated Items
Connected Lookup
Print
Import
Signature
External Data Lookup
Calendar
Rollups
Charts
Counters
List Search
Filters
Item IDs
Color Choice
User Property
Document Link
Voting
Stay in the know
Get helpful videos
Show live KPI counters from SharePoint list data: counts, sums, trends, and percentages, filtered by your conditions. No Power BI, no code needed.

Ultimate Forms: Counter
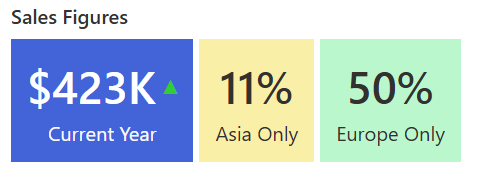
puts live, color-coded KPI numbers on any SharePoint page: open tickets, overdue tasks, orders this month, budget consumed. Each counter counts items or summarizes column values, applies its own conditions, and can show trends against the previous period and percentages of the whole. Multiple counters sit together in one web part, each with its own color scheme, reading directly from your lists with no Power BI and no code.
Every team has one number that decides how the morning goes. Counter puts it where everyone sees it.
The number people actually check
Nobody opens a 40-column list to learn how the queue is doing; they want the number. Without it, "how are we doing" becomes a Monday debate of impressions, or a manually updated figure on a slide that was true last Tuesday. As we argue in Counters make SharePoint dashboards easy, one live counter showing 12 overdue items ends that debate before it starts.Counter makes the number ambient: on the team page, always current, impossible to miss.
What Counter can do
Count what counts
Point a counter at a list and it counts matching items or summarizes a value column: total amount, hours logged, budget spent. Conditions scope each counter to exactly the slice that matters, all items or a filtered subset, so "Open tickets," "Due today," and "High priority unassigned" are three counters on one list, each precisely defined, each updating live.Give the number its context
A raw number invites the question "is that good?" Counter answers it: trend indicators compare against the previous period and mark movement as positive or negative, and values can display as a percentage of the whole. 41 solved this week, trending up; 12 overdue, 8 percent of the queue. The context turns a statistic into a verdict.Build the strip, speak every language
Host multiple counters side by side in one web part, each with its own value column, conditions, and color scheme, so red for overdue and green for resolved read instantly, consistent with your color coding elsewhere. Labels support multiple languages with your own translations, so one dashboard serves an international organization.Anchor the dashboard
Counter is the headline layer of the no-code reporting stack: Charts explain the breakdowns, Rollups span sites, Filters hand control to the audience, and together they build the dashboards that never needed Power BI.Compared with Native SharePoint
| Ultimate Forms | Native SharePoint | |
|---|---|---|
| Display summaries for any list | ✓ |
|
| Automatically calculate based on conditions | ✓ |
|
| Show trends based for instance on the previous period | ✓ |
|
| Show as percentage of the total | ✓ |
|
| You can provide label translations for multiple languages | ✓ |
Where teams use it
"Open, Due Today, Solved This Week" across the top of the Help Desk page. Registered today and pending verification on an intake dashboard. Pipeline value and quotes awaiting approval for sales. Overdue actions on a quality page, where the red number is the agenda. Across the 450+ templates in the Solution Catalog, counters are the first thing every dashboard shows.Frequently asked questions
Q: Can I show a live count of list items on a SharePoint page?
A: Yes. Counter displays live counts from any list on any page, updating as the list changes, with no code or BI tooling.
Q: Can a counter show only items matching conditions?
A: Yes. Each counter carries its own conditions, so it can count exactly the subset you define, such as open items assigned to a team.
Q: Can it sum values instead of counting items?
A: Yes. Counters summarize value columns, totals, amounts, or hours, as well as counting items.
Q: Can it show whether the number is improving?
A: Yes. Trend indicators compare the value against the previous period and display positive or negative movement.
Q: Can several counters appear together?
A: Yes. One web part hosts multiple counters, each with its own aggregation function, conditions, and color scheme.
Q: Does it work in multiple languages?
A: Yes. Counter labels accept translations, so the same dashboard displays correctly for users in different languages.
Screenshots