Your organization runs on processes. Projects must stay on track. Support tickets must be resolved quickly. Sales pipelines must be monitored. Leadership needs visibility. Yet for many teams using SharePoint, there is still a gap between storing information and truly seeing what matters.
The data is there. It lives in SharePoint lists. It is updated daily by staff across departments. But without a clear, visual way to present key measurements, important signals get buried in rows and columns. Managers end up exporting to Excel. Developers reach for complex tools. Teams build one-off reports that require ongoing maintenance. Before long, what should have been simple status visibility turns into a time-consuming technical project.
In our upcoming webinar, we’ll demonstrate how Infowise Ultimate Forms provides a practical, elegant solution: a fully customizable SharePoint Status Board built directly on top of your existing lists. No coding. No expensive add-ons. No complex infrastructure.
Instead of struggling to extract data, you’ll learn how to surface it instantly and present it in a format that leadership, team members, and stakeholders can understand at a glance.
Pick the Metrics That Matter Most
Every organization is different. A help desk team may care about open tickets and response times. A project management group may track milestones and budget variance. Sales leaders may focus on pipeline value and close ratios.
With Infowise Ultimate Forms, you define your own key metrics. Choose the fields and calculations that reflect the true health of your operations. Want to display the number of open issues? Done. Need to calculate overdue tasks automatically? Easy. Want to show the percentage of completed milestones? That’s built in.
You are not locked into a rigid dashboard structure. The board reflects your business priorities.
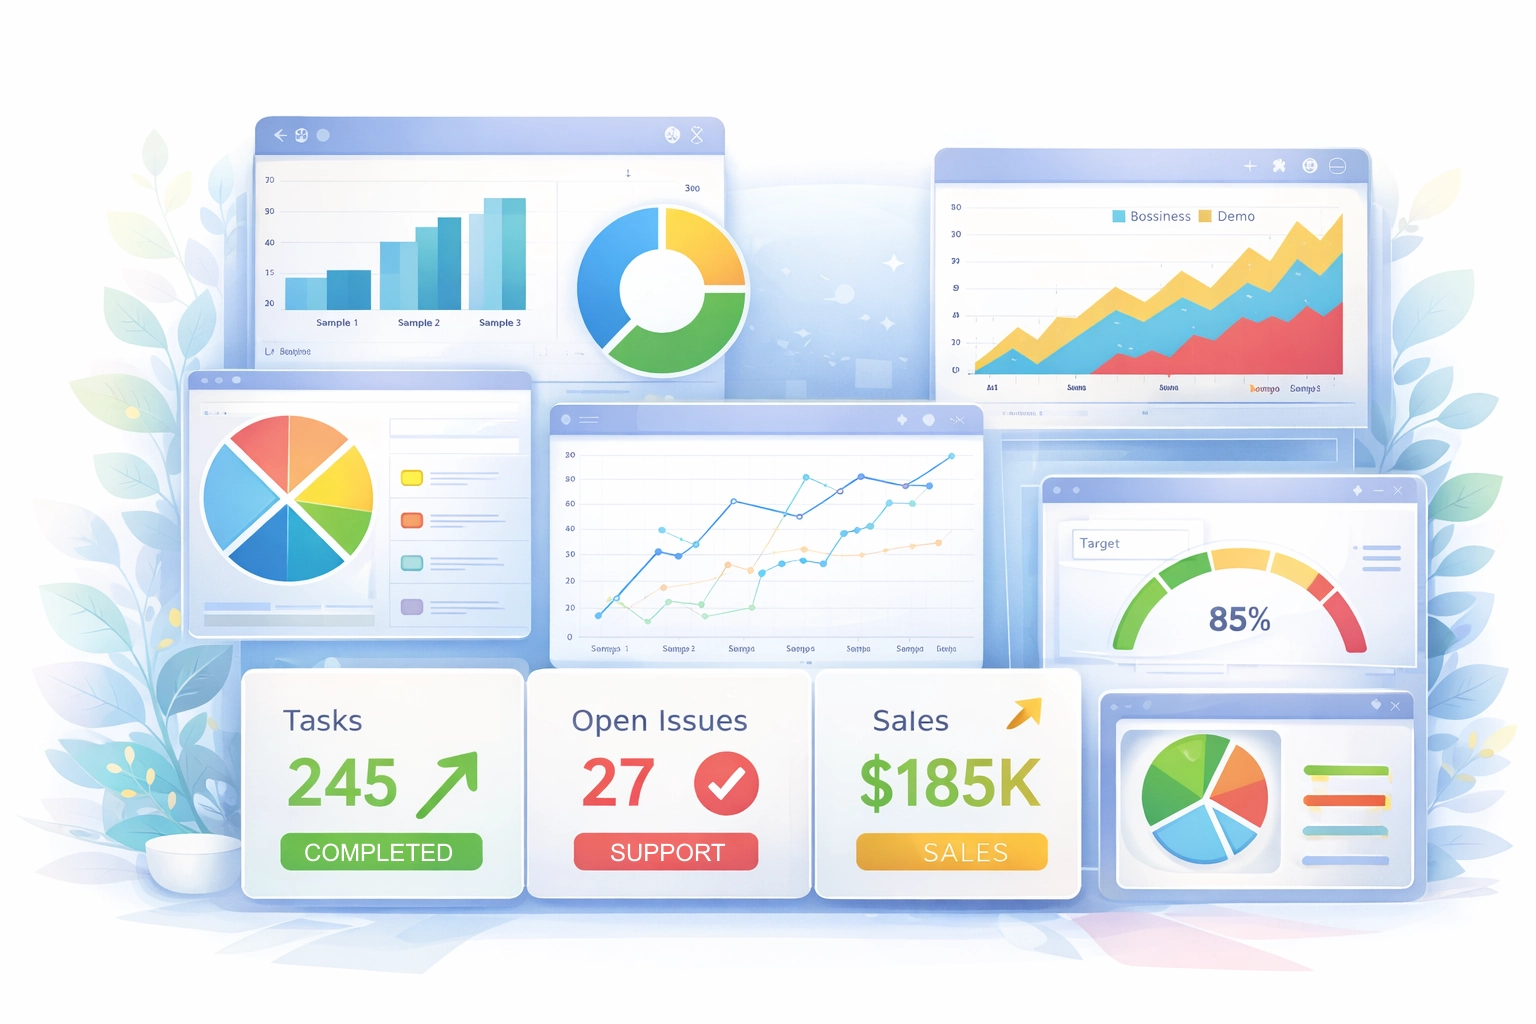
Display Measurements in Clear, Color-Coded Boxes
A status board should communicate instantly. When someone walks by a screen or opens the page, they should understand the situation in seconds.
We’ll show how to present measurements in bold, color-coded tiles. Green means on track. Yellow signals caution. Red highlights areas needing attention. These visual indicators eliminate ambiguity and reduce the need for lengthy explanations.
Instead of asking, “How are we doing?” your teams can immediately see the answer.
Add Interactive Filters for Deeper Insight
High-level visibility is important, but teams also need flexibility. In the webinar, we’ll demonstrate how to add interactive filters that allow users to narrow the data by department, date range, project type, priority level, or any other relevant dimension.
With a few clicks, a manager can move from organization-wide metrics to team-specific insights. There’s no need to open multiple reports or request custom exports. The same board adapts dynamically to user selections.
This makes the status board not just a display tool, but an interactive management tool.
Automatically Roll Up Key Data
Many SharePoint dashboards fail because aggregating data across lists is complicated. Teams often rely on Power Automate flows or external reporting systems to calculate totals and summaries.
Infowise Ultimate Forms simplifies this process. We’ll show how to automatically roll up counts, sums, averages, and calculated values directly from your SharePoint lists. As items are created or updated, the board reflects the new totals without manual intervention.
This eliminates duplicate data entry and reduces the risk of inconsistent reporting.
Data Refreshes Automatically
A status board is only valuable if it reflects current information. Static screenshots and manual refreshes defeat the purpose.
The SharePoint Status Board we demonstrate will refresh automatically as list data changes. When a ticket is closed, the open count decreases. When a project milestone is completed, the completion percentage adjusts. When new sales opportunities are added, totals increase.
Your board becomes a living representation of your organization’s activity.
Looks Great on Large Displays
Many organizations mount large screens in operations centers, support areas, manufacturing floors, or executive spaces. A well-designed status board should be readable from across the room.
We’ll show how to configure the layout so it looks clean and professional on large TVs and monitors. Bold metrics, clear labels, and structured alignment ensure that your information is visible and impactful in shared spaces.
Create Custom Boards for Each Team
Different teams have different priorities. Instead of building a single overloaded dashboard, you can create focused boards for each department.
Support can have one board. Projects can have another. Sales can maintain its own view. Executives can have a summarized, high-level board that rolls up the most important metrics from across the organization.
Each board is built from the same underlying SharePoint data but tailored to its audience.
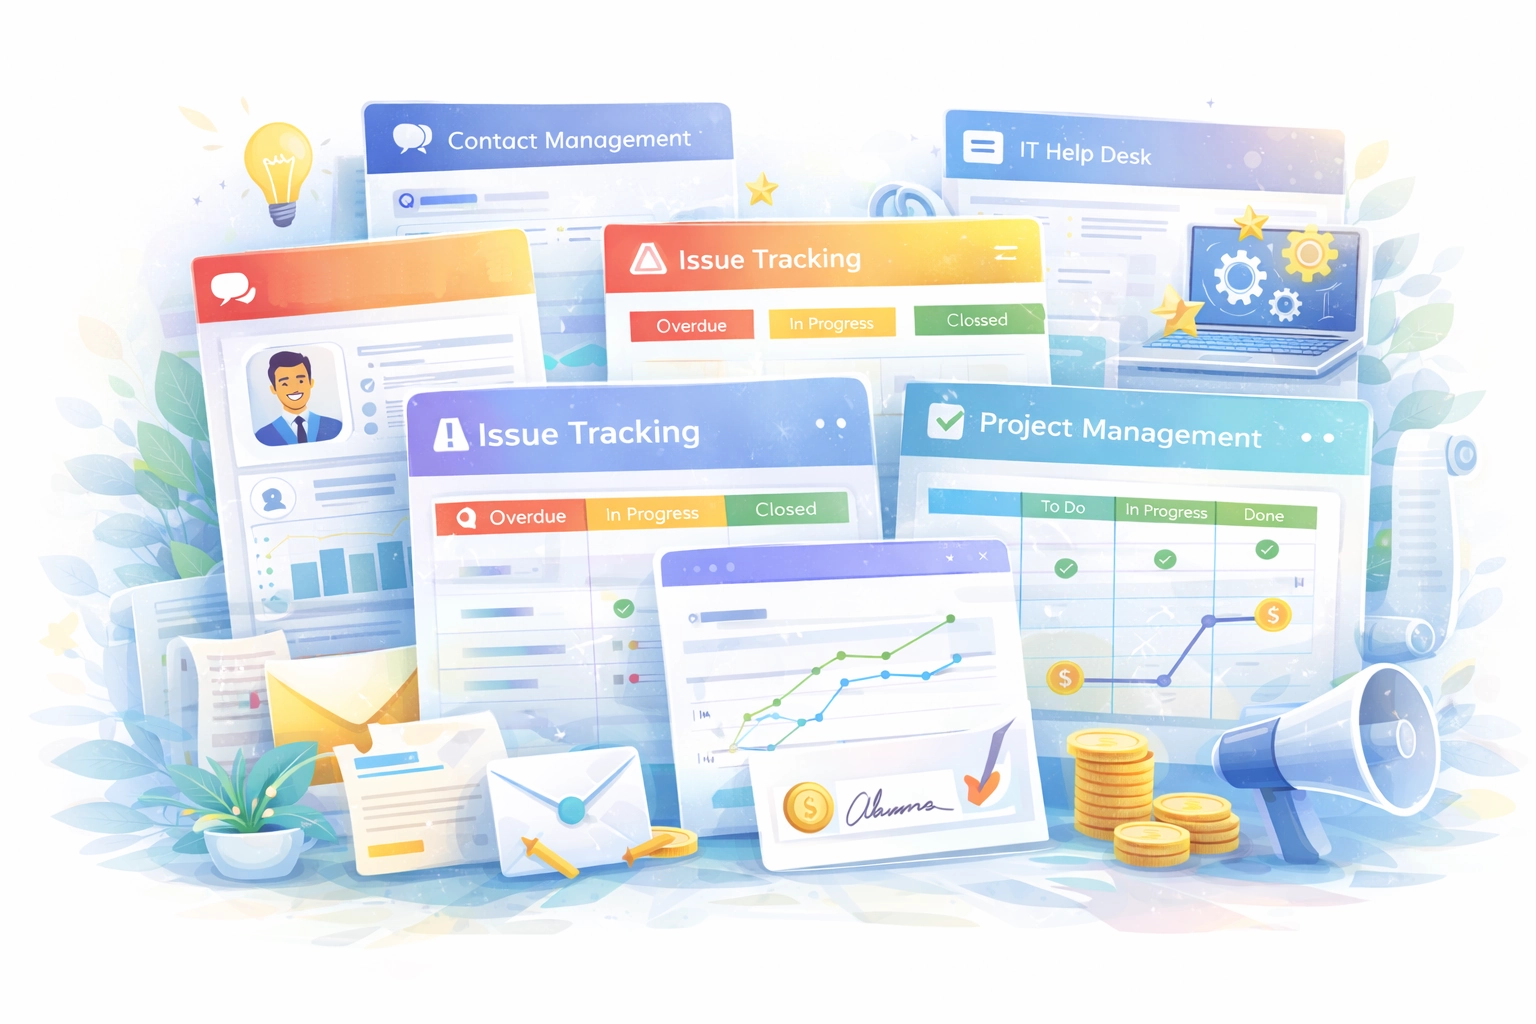
Track What Matters: Tickets, Projects, Sales, and More
The possibilities extend far beyond a single use case. During the webinar, we’ll demonstrate scenarios such as:
-
Open support tickets and SLA compliance
-
Project health and milestone tracking
-
Sales pipeline totals and monthly performance
-
Task completion rates
-
Compliance and approval status
If the data exists in SharePoint, it can be surfaced on your status board.
If your organization has struggled to display meaningful status information without heavy development or expensive licensing, this session is for you.
Join us to learn how to build your own powerful SharePoint Status Board using Infowise Ultimate Forms. You’ll see exactly how to configure the lists, forms, views, automation, and board layout step by step.
As a bonus, all attendees will receive the complete solution template immediately after the presentation — including lists, forms, views, automation components, and the full Status Board page — so you can implement the solution in your own environment right away.
Don’t miss this opportunity to transform how your organization monitors critical processes and turns SharePoint data into actionable insight.
At Infowise, we serve as your strategic partner, assisting in your digital transformation. ULTIMATEforms contains a wide array of SharePoint components, developed to give you the power to innovate, automate, and scale up your processes. ULTIMATEforms helps you create amazing, advanced business solutions based on your SharePoint lists and document libraries, using nothing but your browser! Anything from simple Leave Request or Expense Report and all the way to complex Help Desk or Project Management solutions can be built in minutes, without writing a single line of code.
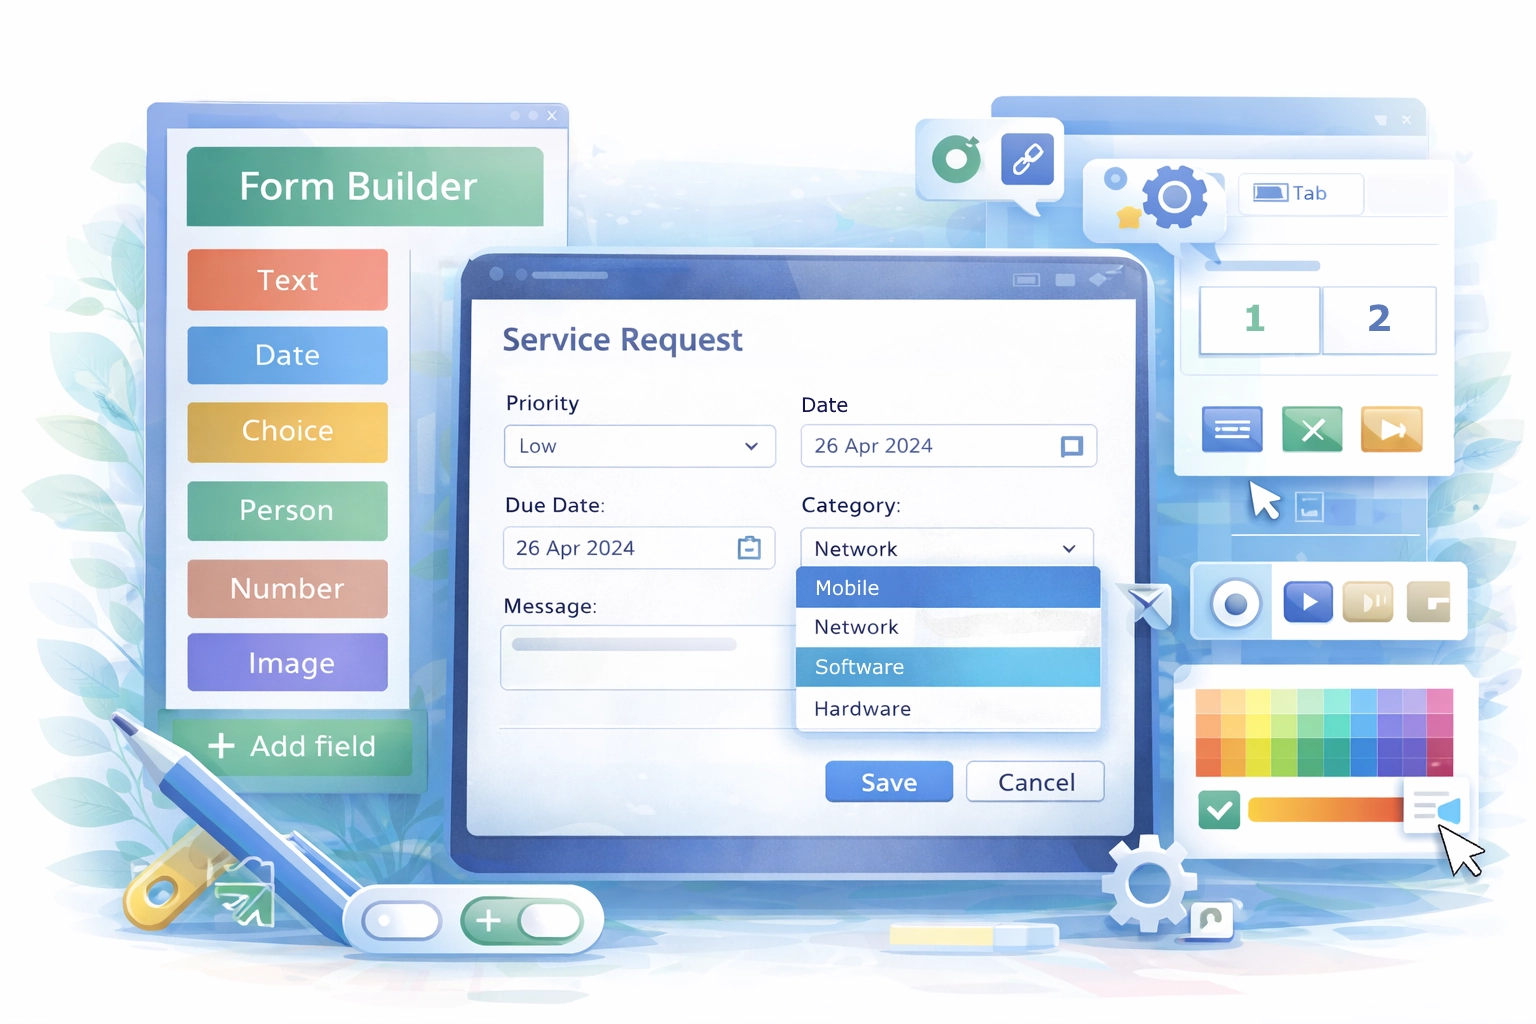
Flexible Forms That Work the Way Your Business Does
Create modern, responsive forms in SharePoint that are easy to build and even easier to use. Add tabs, control who sees what, validate input, and capture complex data with repeating sections and electronic signatures.
Build forms that guide users, reduce mistakes, and keep your processes running smoothly, all while your data stays securely inside SharePoint.
Automation Without The Complexity
Replace complicated workflows with simple, powerful Actions that run directly inside SharePoint. Create, update, and connect data across systems like Exchange, SQL, and Teams with just a few clicks.
Set up automation in minutes, not hours, and give more people the ability to build and manage solutions without relying on developers or getting stuck in long backlogs.

Clear Reporting That Drives Action
Turn your SharePoint data into dashboards, reports, KPIs, calendars, and charts that are easy to understand and share.
Give your team real visibility into what is happening so they can respond faster, stay accountable, and make better decisions every day.
Pre-Built Solutions That Get You Started Fast