You can build a complete social media post tracking system in SharePoint in about ten minutes, without code. We did exactly that at Infowise, using the AI-assisted Form Generator in Ultimate Forms to draft the list structure from a one-sentence prompt, then refining it with a repeating section for posts and summary columns that automatically count posts, total impressions, and calculate averages per category. This article walks through the entire build, screenshot by screenshot, and every step applies just as well to whatever tracker your own team is missing.
The system still runs our social media planning today. Here is how it came together.
The problem: posting more means tracking more
When we decided to post more actively on social media to show off Ultimate Forms features, we ran into the problem every content team knows. Without a system, you cannot answer the basic questions: which features have we already covered, when did we last post about each one, and which posts actually performed? Keep going without answers and you repeat yourself, neglect whole topics, and learn nothing from the numbers. Spreadsheets are where this kind of tracking usually goes to die, one per person, none current.
Naturally, we built it in SharePoint with our own product. The interesting part is not that we did, but how little time it took, because the process demonstrates a build pattern worth stealing: let AI draft the structure, then apply judgment where it counts.
Step 1: Let AI draft the list
The Form Generator turns a plain-language prompt into a proposed list schema. Since I wasn't sure what a tracking system like this would need, I deliberately kept the prompt short and generic, and asked for no more than 15 suggested columns:

A few seconds later, the draft came back. One thing to know: the same prompt can and will produce different results each time you run it, so your output may vary from mine. That is fine; the draft is a starting point, not a verdict:
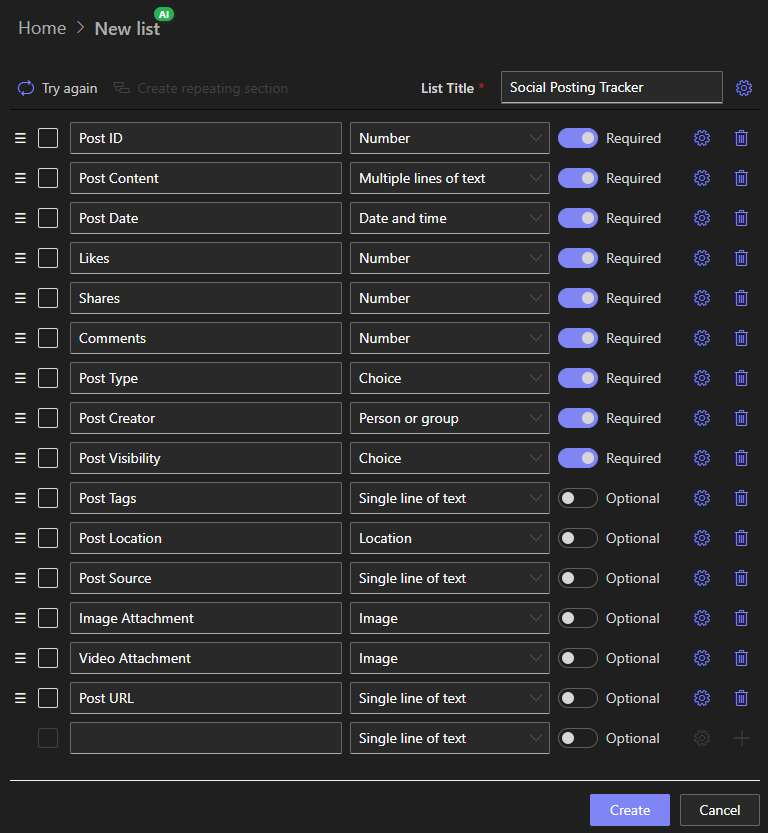
Step 2: Apply judgment to the draft
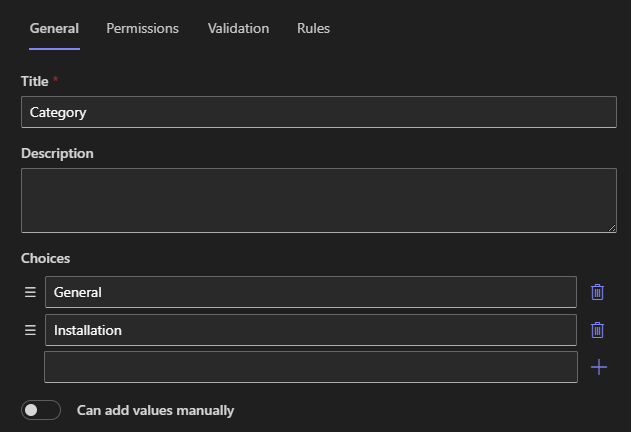
The suggestions generally made sense, but a generic draft never fits a specific team perfectly. And this is where the ten minutes earn their value. I added a Category choice column holding our main post categories, Installation, Forms, Actions, and so on, essentially mirroring the product's feature areas, because "what have we covered?" was the core question the system had to answer. I also deleted several columns I didn't need:
The intermediate result kept the majority of the AI's columns, with a few removed and a few added. Because the list doesn't exist yet at this stage, restructuring is instant; there is no data to migrate and nothing to break:
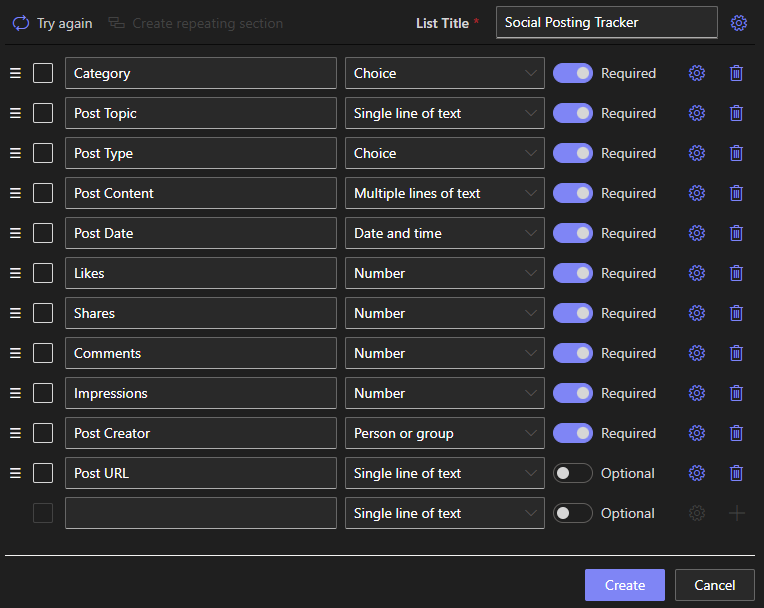
That last point deserves a highlight. The cheapest moment to change a data structure is before it exists, and drafting with AI puts all your structural decisions into exactly that moment.
Step 3: One category, many posts
A flat list would give me one row per post, but the natural shape of this data is hierarchical: each Category accumulates multiple posts over time. So I promoted the post-related columns into a repeating section, turning each category item into a parent holding as many post entries as it will ever need:
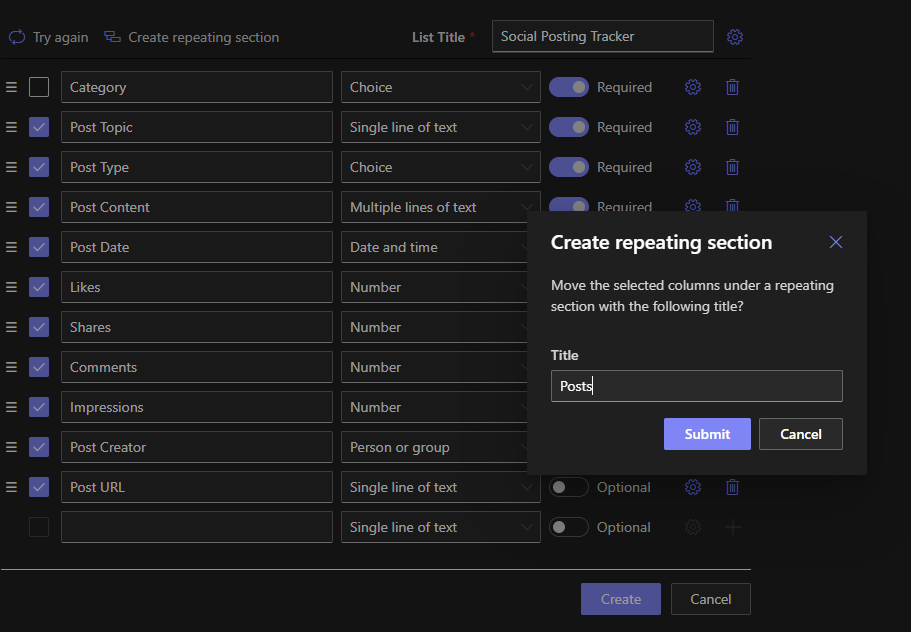
Step 4: Summaries that calculate themselves
With posts nested under categories, summary columns do the reporting automatically, recalculating whenever a post is added. I set up four:
- The number of posts per category, a simple count:
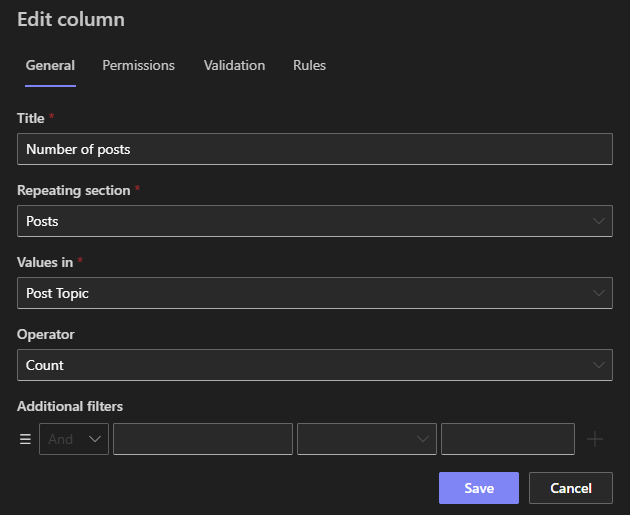
- The date of the first post for the category:

- The total impressions across the category's posts:
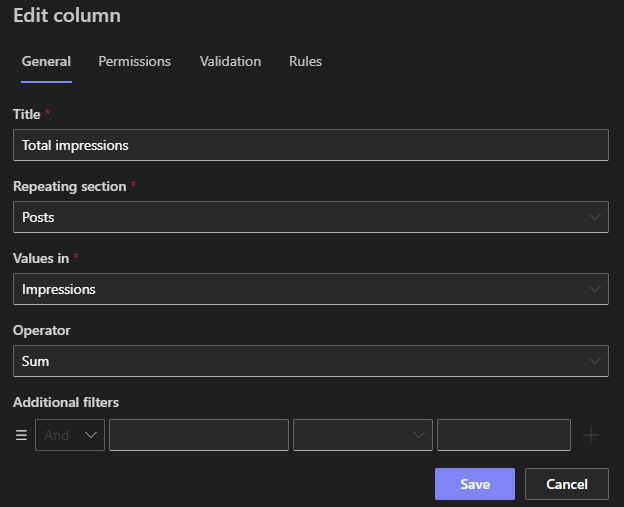
- The average impressions per post
Between them, these four answer every question the system was built for. Count and first-date show coverage and staleness; total and average impressions show what resonates. Nobody updates these numbers, ever; they are properties of the data, not chores. (The same mechanism scales to full dashboards, as covered in Calculate Real-Time Summaries of Related Items.)
Step 5: Generate, polish, done
With the structure settled, the list was ready to generate:
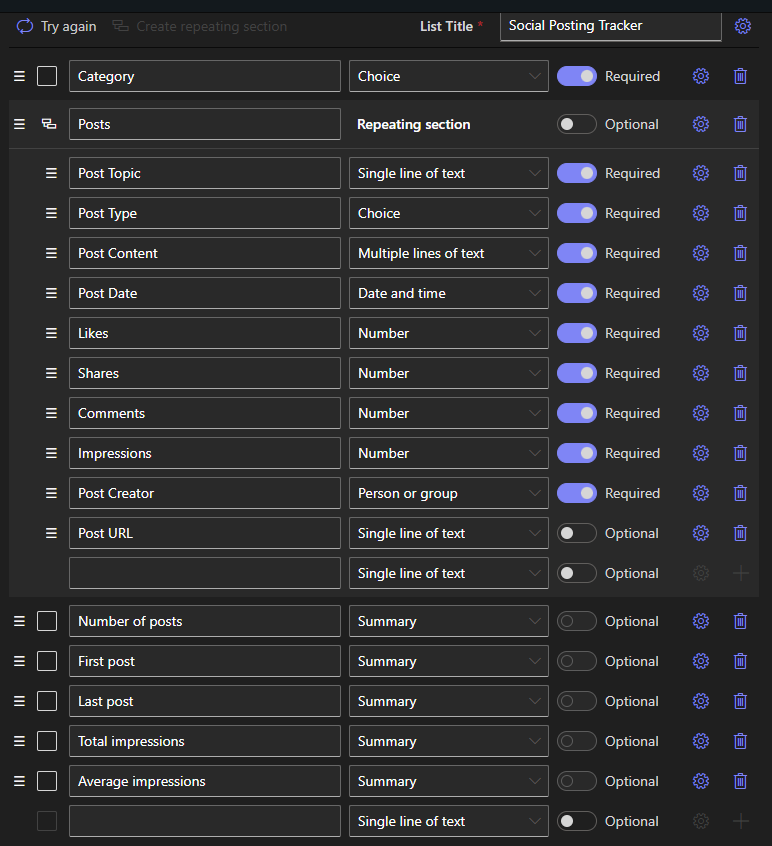
Once created, you can open the New form immediately or refine it in Form Designer. The Form Generator had already produced a working top-to-bottom form, so the only polish I applied was layout. I placed the summary columns in a container with three layout columns across, to save vertical space.
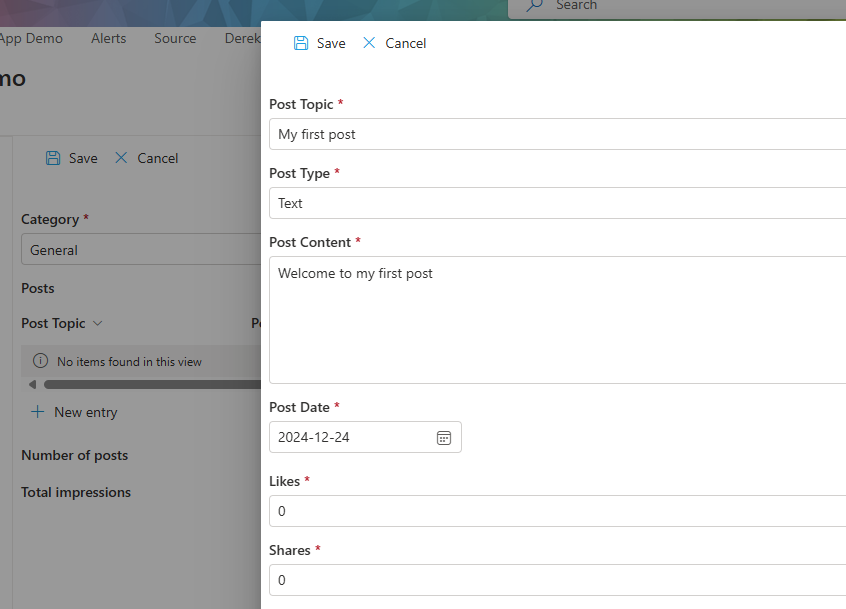
And the form is ready. The working rhythm is: create a Category once, then add posts to it over time, as many as needed, with every summary recalculating automatically on each addition:
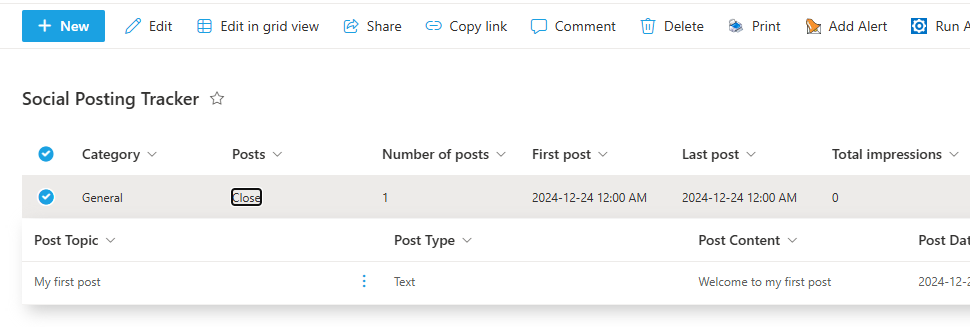
In the list view, the categories appear as rows with the ability to drill down into each category's posts:
What the ten minutes actually teach
The entire build took about ten minutes, and that included stopping to take screenshots. But the transferable lesson is the division of labor: the AI handled the blank-page problem, proposing a reasonable structure instantly, while the human decisions, the Category taxonomy, the parent-child shape, the four summaries that matter, took judgment no generator has. That split is the fastest way we know to build any tracker: content calendars, campaign logs, event pipelines, feature request boards. It is one of the four ways to build SharePoint lists and forms, and for this kind of from-scratch, loosely-defined system, it is usually the right one.
Frequently asked questions
Add your comment